P03-28
Estimation of transmission routes of the COVID-19 BA.1.1.2 variant using McAN and 3D graph visualization
Masafumi SAITO *1, Yoshinori TAKAHASHI2, Yasunori IWATA3, Kenji SATOU4
1Graduate School of Natural Science and Technology, Kanazawa University
2Department of general medicine and infectious diseases, JA Toyama Koseiren Takaoka Hospital
3Department of Nephrology and Rheumatology, Kanazawa University
4Institute of Transdisciplinary Sciences for Innovation, Kanazawa University
( * E-mail: saito562943@gmail.com )
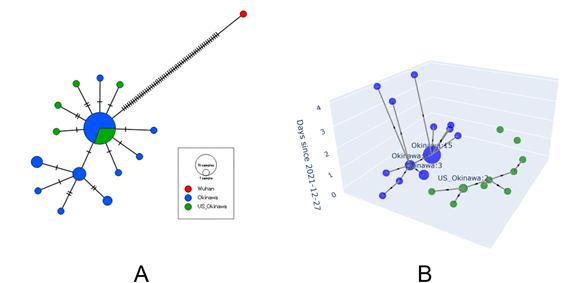
In 2019, the COVID-19 quickly spread worldwide and caused many infection clusters. To prevent such clusters and future outbreaks, it is important to track the transmission routes of infections and identify how the virus spreads in these clusters. Previous studies have reported that phylogenetic analysis on the whole genome sequences of viruses can reveal detailed transmission routes. In this study, we analyzed the transmission routes of an Omicron variant (BA.1.1.2) infection cluster that appeared in Okinawa Prefecture in Japan at the end of December 2021. This cluster is considered to have started from infections among US military personnel at a base in Okinawa and then spread further. We conducted a phylogenetic analysis using the genome sequences of BA.1.1.2 variant from 42 infected individuals found in Okinawa between December 27 and December 31, 2021. Among these, 11 strains came from US military personnel, and 31 strains were from community infections in Okinawa. By comparing these genome sequences with the reference genome sequence from Wuhan, China, we identified the genetic relationships among the viruses and estimated the local transmission routes. To understand the transmission routes, we used two methods: the median-joining network and McAN haplotype network analyses. The median-joining network method calculates genetic distances between viruses based on their mutations and constructs a network to visualize the transmission routes. This method is widely used for tracking transmission. The McAN method is a new algorithm that considers specific mutations and infection dates to create the network. The result of the median-joining network analysis is shown in Figure A on the left. Each node represents one or more viruses, with green nodes indicating infections in US military and blue nodes indicating community infections. The number of marks on the lines between nodes shows the number of mutations. The central large node clusters strains with very similar genetic distances, making it hard to distinguish between community and military infections. It was also difficult to determine if the infections started from US military personnel. In contrast, the McAN analysis result in Figure B on the right shows that infections by US military personnel and community infections formed separate clusters, suggesting no direct relationship. This result indicates that the median-joining network and McAN methods might lead to different conclusions when analyzing infection clusters. Furthermore, our study suggests that McAN can build networks considering mutation types and infection dates, and visualize detailed transmission routes, including their timelines, using a three-dimensional directed graph.
